Consumers and Incentives
Learning Objectives
- Illustrate the role of preferences, income, and prices of goods and services in forming a buyer’s Demand for a good or service
- Demonstrate marginal analysis in understanding the behaviour of buyers
- Understand and show that every point of the demand curve is the result of a consumer using marginal analysis to maximise satisfaction from things she buys, and how much things cost.
- Correctly use the tools of optimisation to show how incentives (and policies/prices) affect consumer behavior
- positive incentives: rewards for good behavior
- negative incentives: punishments, e.g. fines
- Understand what consumer surplus is and how it’s measured
- whether changes in prices, market conditions, or policies make buyers worse/better off
- Define, calculate, and interpret different demand elasticities
- examining Law of Demand’s inverse relationship more
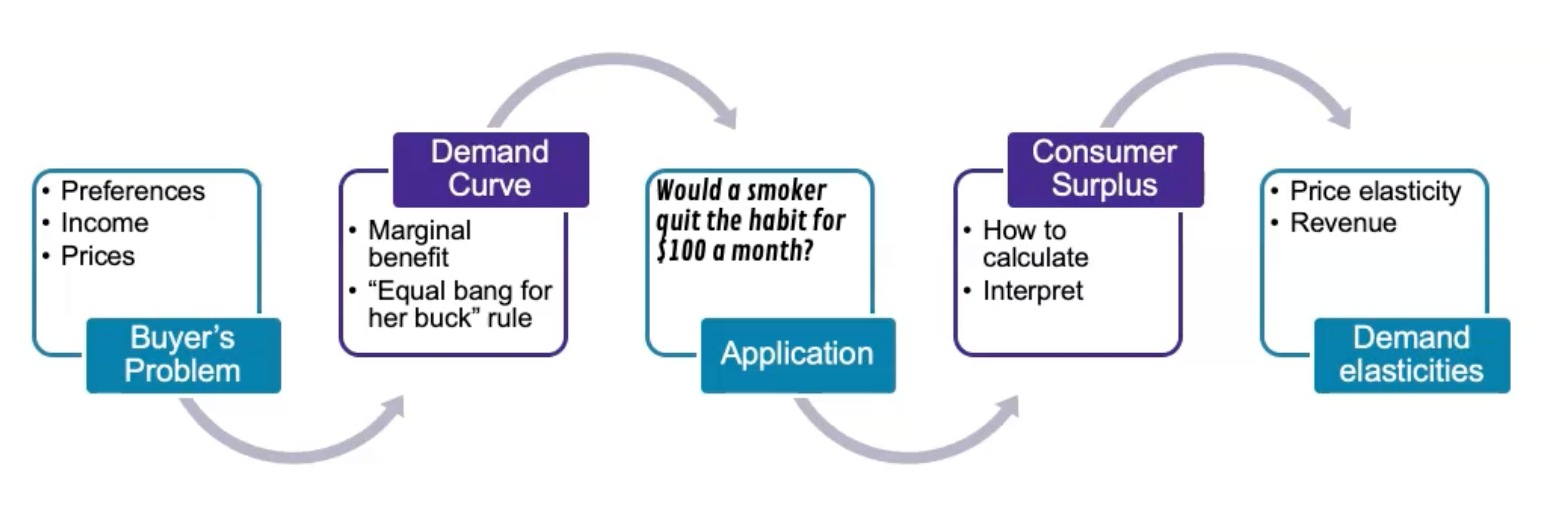
The Buyer’s Problem
Learning Objectives
- Identify and depict the 3 basic elements of the buyer’s problem: preferences, income, and prices
- Construct a budget line and interpret its properties
Summary
Summary
Deciding what to buy, such that she makes the most of her resources given her constraints.
- What she likes
- everyone wants the biggest bang for their buck
- what we buy reflects our tastes and preferences
- satisfaction = utility
- utility: ability to provide satisfying use or enjoyment
- satisfaction = utility
- econs doesn’t judge
- What it costs
- buyer takes the prices as fixed with no bargaining
- you can buy as much as you want without increasing demand/driving the price up
- What’s her budget
- there is no saving or borrowing, only buying within the budget
- even though we use a straight line to represent purchase choices, we only purchase whole units
Objective
Choose the mix of Good X and Good Y that maximises her utility, out of all possible mixes she can afford.
- quantity of Good X and Good Y:
- prices:
- bundle:
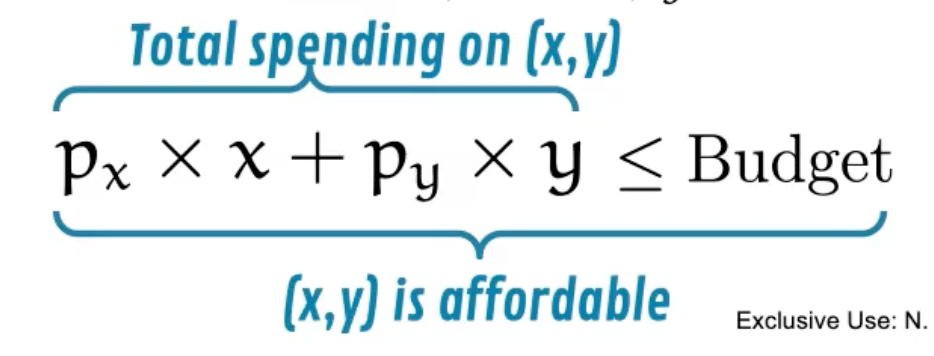
- bundles below the graph line are affordable bundles
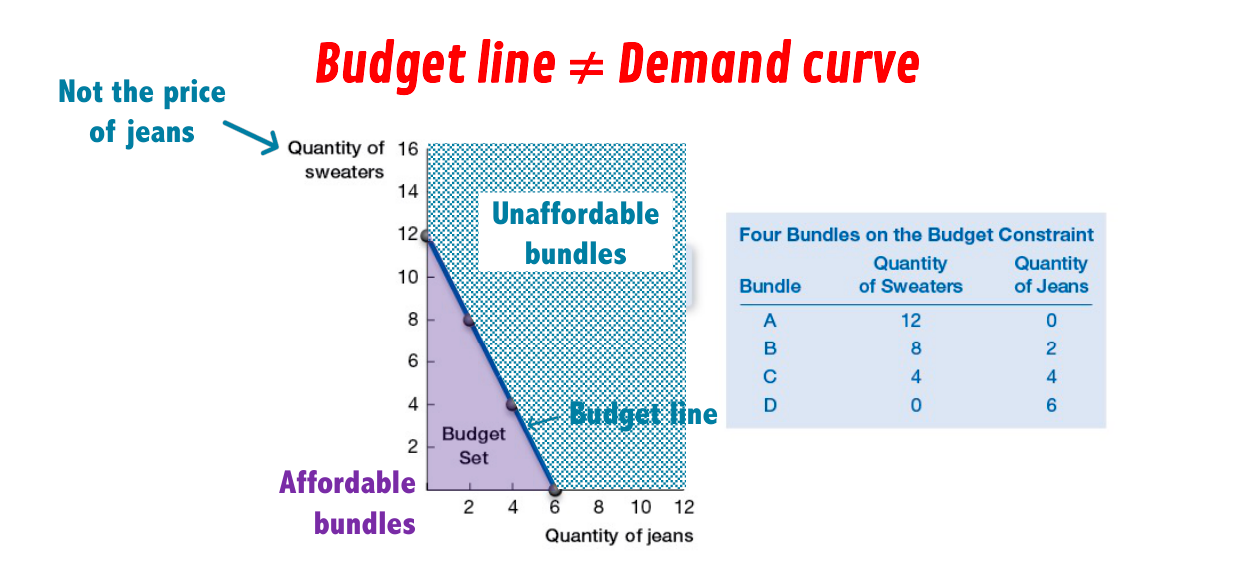
- second area consists of bundles that are outside the budget line, that cost more than 300 dollars
- no borrowing, so these bundles are unaffordable
Important
Don’t confuse the budget line with the demand curve.
- With a demand curve, price would be on the y axis.
- With a budget line, both the x and y axes measure quantities.
- opportunity cost: the benefit forgone to get something
- any trade-off involves an opportunity cost
- if more is better + buyer wants to maximise satisfaction → must use entire budget → optimal bundle is on the budget line
- to find optimal bundle, we need to know her tastes and preferences
Benefits
- ceteris paribus, the more sweaters/jeans bought, the greater the total benefits when only one good is consumed
- compare the benefits table and sum it up to find the highest total → optimal budget
- do NOT add total benefit of 4 sweaters to 8 sweaters to make 12 because of the law of diminishing marginal utility
- optimisation by marginal analysis lets us find the optimal bundle
Marginal analysis
Definition
Allocate any additional spending to the item that increases utility the most in per dollar terms, until the entire budget is used up.
- marginal benefit: change in total benefit
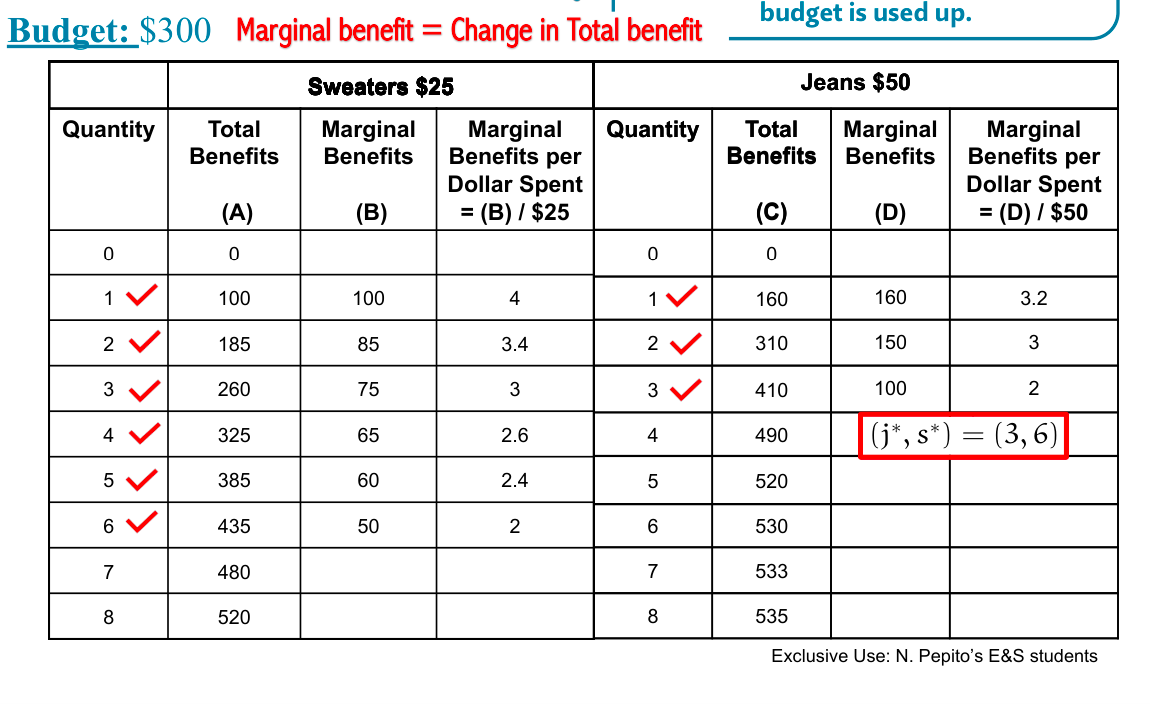
- marginal benefit does not give the correct answer → need marginal benefit per dollar spent
- jeans has more marginal benefit, but jeans are 2x price of sweaters
- divide marginal benefit by cost of item to derive merginal benefit per dollar
- ensures buyer gets most utility from entire budget
- marginal benefit per dollar should be equal across both goods
- zero row can be skipped
- marginal benefit per dollar remains the same whether you pay or it’s free – to allow an impartial measure of benefit
- but if it’s free, the cost is irrelevant → e.g. 7 tunas free, cost begins from 8th tuna and correspond it to the marginal benefit
Info
We don’t explicitly calculate marginal benefits every time we shop, but we behave as if we do
- like slowing down at a stop sign without knowing physics behind it
Edge case: not matching the marginal benefits
- sometimes your marginal benefit per dollar does not match and you’re left with an inequality
- yet you can't buy more salmon because it’s out of budget; to shift the demand to the left would decrease satisfaction even more → this is the best you have → this is the optimal bundle
Incentives
- e.g. $100/month to quit smoking
- quitting smoking has an opportunity cost or at least one the smoker perceives
- benefit from not smoking for a month is 2 sweaters and 1 pair of jeans
- financial incentives are powerful in place; when they end, people tend to return to old habits
- in order to stick, incentives should be recurring
Cash vs cash-in-kind
- cash assumes the consumer knows what’s best for themselves and enables them to allocate the budget by their own preferences
- best for free market
- cash-in-kind allocates for the consumer and assumes they don’t know what’s best for them; forces the cash to be used for its intended purpose
- better from a policy perspective, better in command economies
Consumer surplus
Definition
consumer surplus: the difference between willingness to pay, and price the buyer actually pays
- e.g. if a consumer is willing to pay $100 but the jeans are $50, consumer surplus is $50
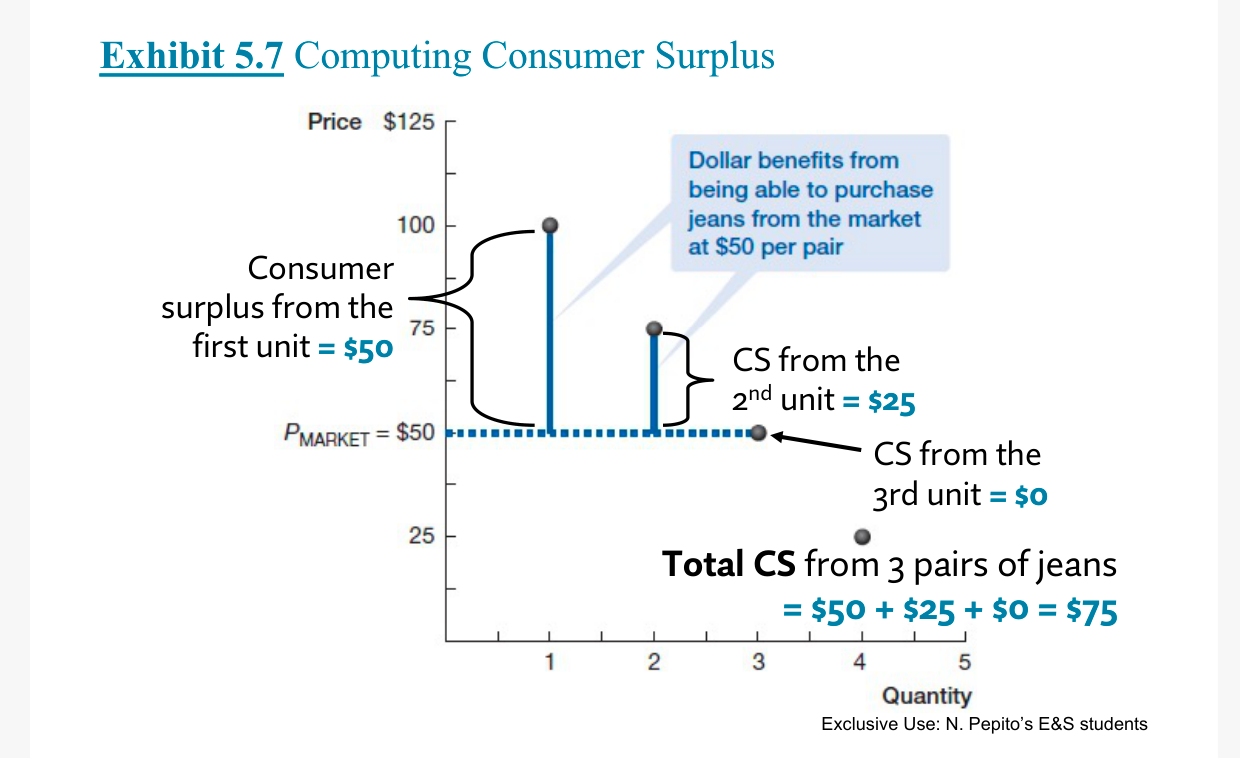
- when market demand curve is linear, consumer surplus is a triangle which you just find the area of
- if it’s not linear → not a triangle → use of integral calculus to create consumer surplus
- harder math for not much additional insight → demand curves are simplified to linear
Formula
Defined by:
- choke price (p-max)
- market price
- quantity bought at that price
What if…
- price increases → loss in consumer surplus → measure of empty feeling consumers get when a good they’ve been buying becomes more expensive
- price decreases → increase in consumer surplus → enjoy consumer surplus
Demand elasticities
- elasticity: a measure of how sensitive one variable is to changes in another variable, ceteris paribus
- mathematically, a ratio of percentage changes
- demand elasticity: responsiveness of quantity demanded to changes in certain variables
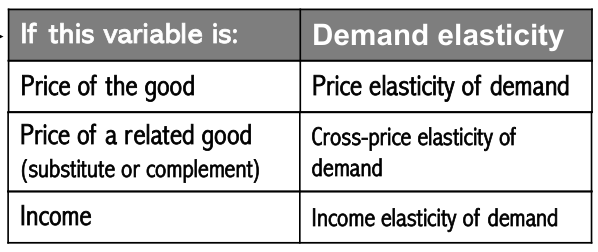
- price elasticity of demand: the responsiveness of the quantity demanded of a good or service to a change in its own price.
- as quantity demanded, as price of good itself → ratio of percentage changes
- price & quantity are inverse → one negative, one positive → drop the sign when interpreting
- often represented by , or PED
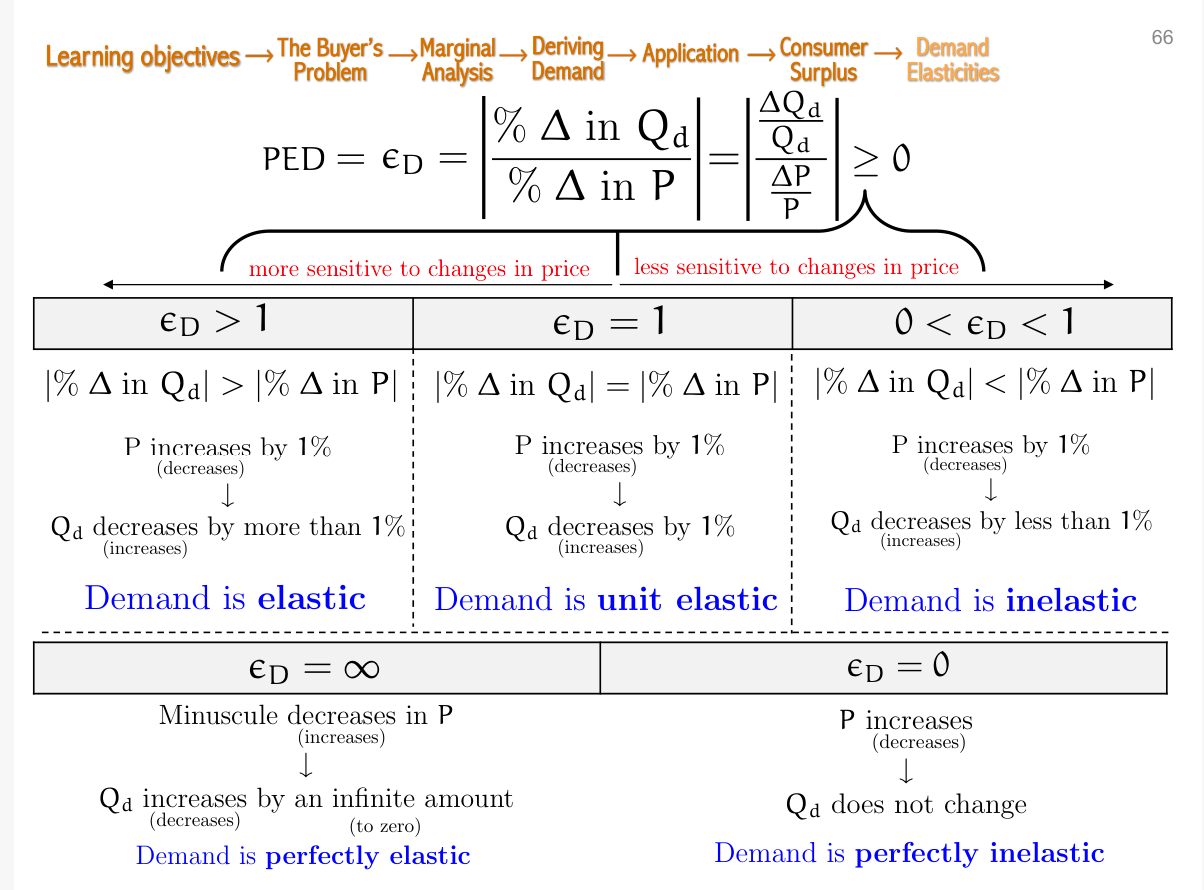
- if change is more than 1%, demand is elastic
- if change is less than 1%, demand is inelastic
- tend to be necessities, e.g. soap, shampoo because no substitutes
- “The more broadly a product is defined, the fewer the substitutes, whereas the narrower a product is defined, the more substitutes it has.”
- “The bigger the number, the more elastic is demand, and the more sensitive consumers are to changes in price. The smaller the number, the less sensitive they are.”
- its effect on revenue:
- if demand is elastic, quantity demanded is responsive to price decreases too
- total revenue = price quantity sold/demanded → ceteris paribus, decrease revenue but increase in quantity increases revenue
- if demand increases more than decrease in revenue, overall effect is for last-minute Broadway tickets to be higher than regular prices
- you make less but sell more
- for show tickets, costs are stable no matter how many people are in the theatre
- cross-price elasticity of demand: the responsiveness of quantity demanded to changes in the price of another good
- DO NOT DROP THE SIGN
- How much does the quantity demanded of a good change when the price of another good changes? How responsive is quantity demanded of x to changes in the price of good y, all else held constant?
- elasticity w.r.t. another good
- cross-price elasticity assumes ceteris paribus
- when A vs B → increase of B increases quantity of A people buy → percentages have opposite signs → cross-price elasticity of demand between substitutes is positive
- income elasticity of demand: the responsiveness of quantity demanded to changes in income
- DO NOT DROP THE SIGN
- income elasticity is positive but ≤ 1 → quantity demanded increases proportionally less than income → total spending on necessity takes up smaller proportion of income as buyer’s income increases
- if ≥ 1 → total spending on good takes up greater proportion
- e.g. luxury goods, big-ticket items
Exercises
1. Rent Control
- demand for rental apartments increases in the city
- strict rent control laws keep supply limited at S
- shortage develops from rent control
- landlords use non-price criteria – e.g. tenant financial background, personal references, perceived reliability – to choose among applicants → preference-based rationing
- if laws change or developers find loopholes, supply may increase → moderating prices
- demand rises to S’ (S-star), though it won’t hit P**
2. Sushi restaurant
Circular transclusion detected: consumers--and--incentives