Demand
Learning objectives
- Understand the “Law of Demand”
- Learn how to draw the demand curve
- Learn how to “interpret” the demand curve
Case Study: Petrol
- not perfectly competitive
- assume that there are no brands, take petrol as a broad category
- simplifications like these help get a handle on reality in economics → more confidence in analysing the more complicated version later on
Question
What factors lead consumers buy more or less petrol?
- my answer
- ✅ price – lower price → more purchase
- usage of petrol (i.e. are they commuting more? commuting further distances?)
- purchase of cars
- price of petrol substitutes; if cheaper, buyers will trend towards these over petrol
- e.g. natural gas, diesel, electricity
- Population
- income
- environmental concerns
- expectations of future petrol prices
Summary
If none of the other factors change, there’s an inverse relationship between the quantity of petrol bought and the price of petrol.
Law of Demand
Law of Demand
Law of Demand
Quote
All else held constant, the lower the price of a good, the higher the quantity demanded; the higher the price, the lower the quantity demanded.
Link to original
- ceteris paribus: all else held constant (Latin)
- quantity demanded: amount of a good buyers are willing to purchase at a given price
Demand curve
Summary
The demand curve plots the quantity demanded at different prices. (MAY NOT BE LINEAR because it depends on buyer behaviour)
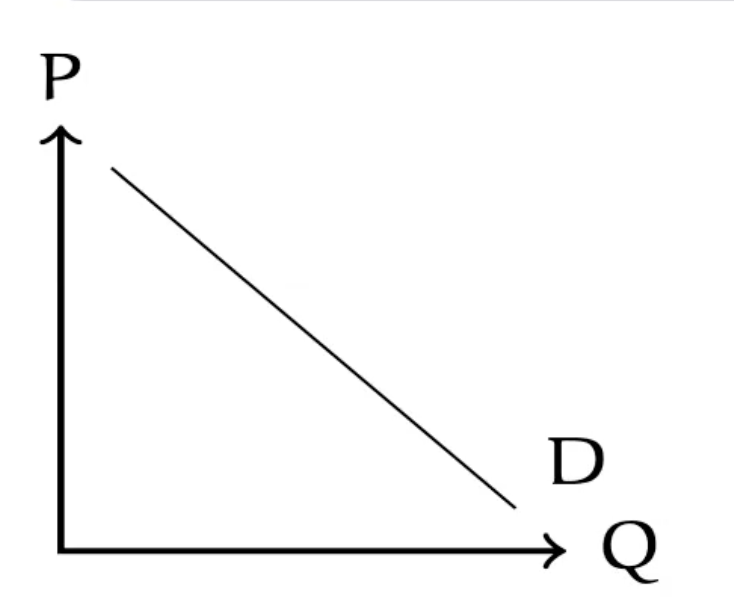
- demand curve is a downward sloping curve (assuming price as y and quantity as x)
- can be read horizontally; e.g. P = $3.50, = 10
- willingness to pay: the most someone in the market is willing to pay for a particular unit
- when you read a demand curve vertically
- when quantity demanded changes along a demand curve, it’s only due to changes in the price
- choke price: the price there is no quantity demanded
- freebie quantity: quantity demanded when price is zero
- demand schedule: table reporting the quantity demanded at different prices, ceteris paribus

- it’s a cumulative table; anyone willing to pay $5 is also willing to pay $2
- unit demand: when consumers are only interested in buying ONE unit of the good
- quantity demanded = number of buyers
Problem 1: Laundry detergent
My answer:
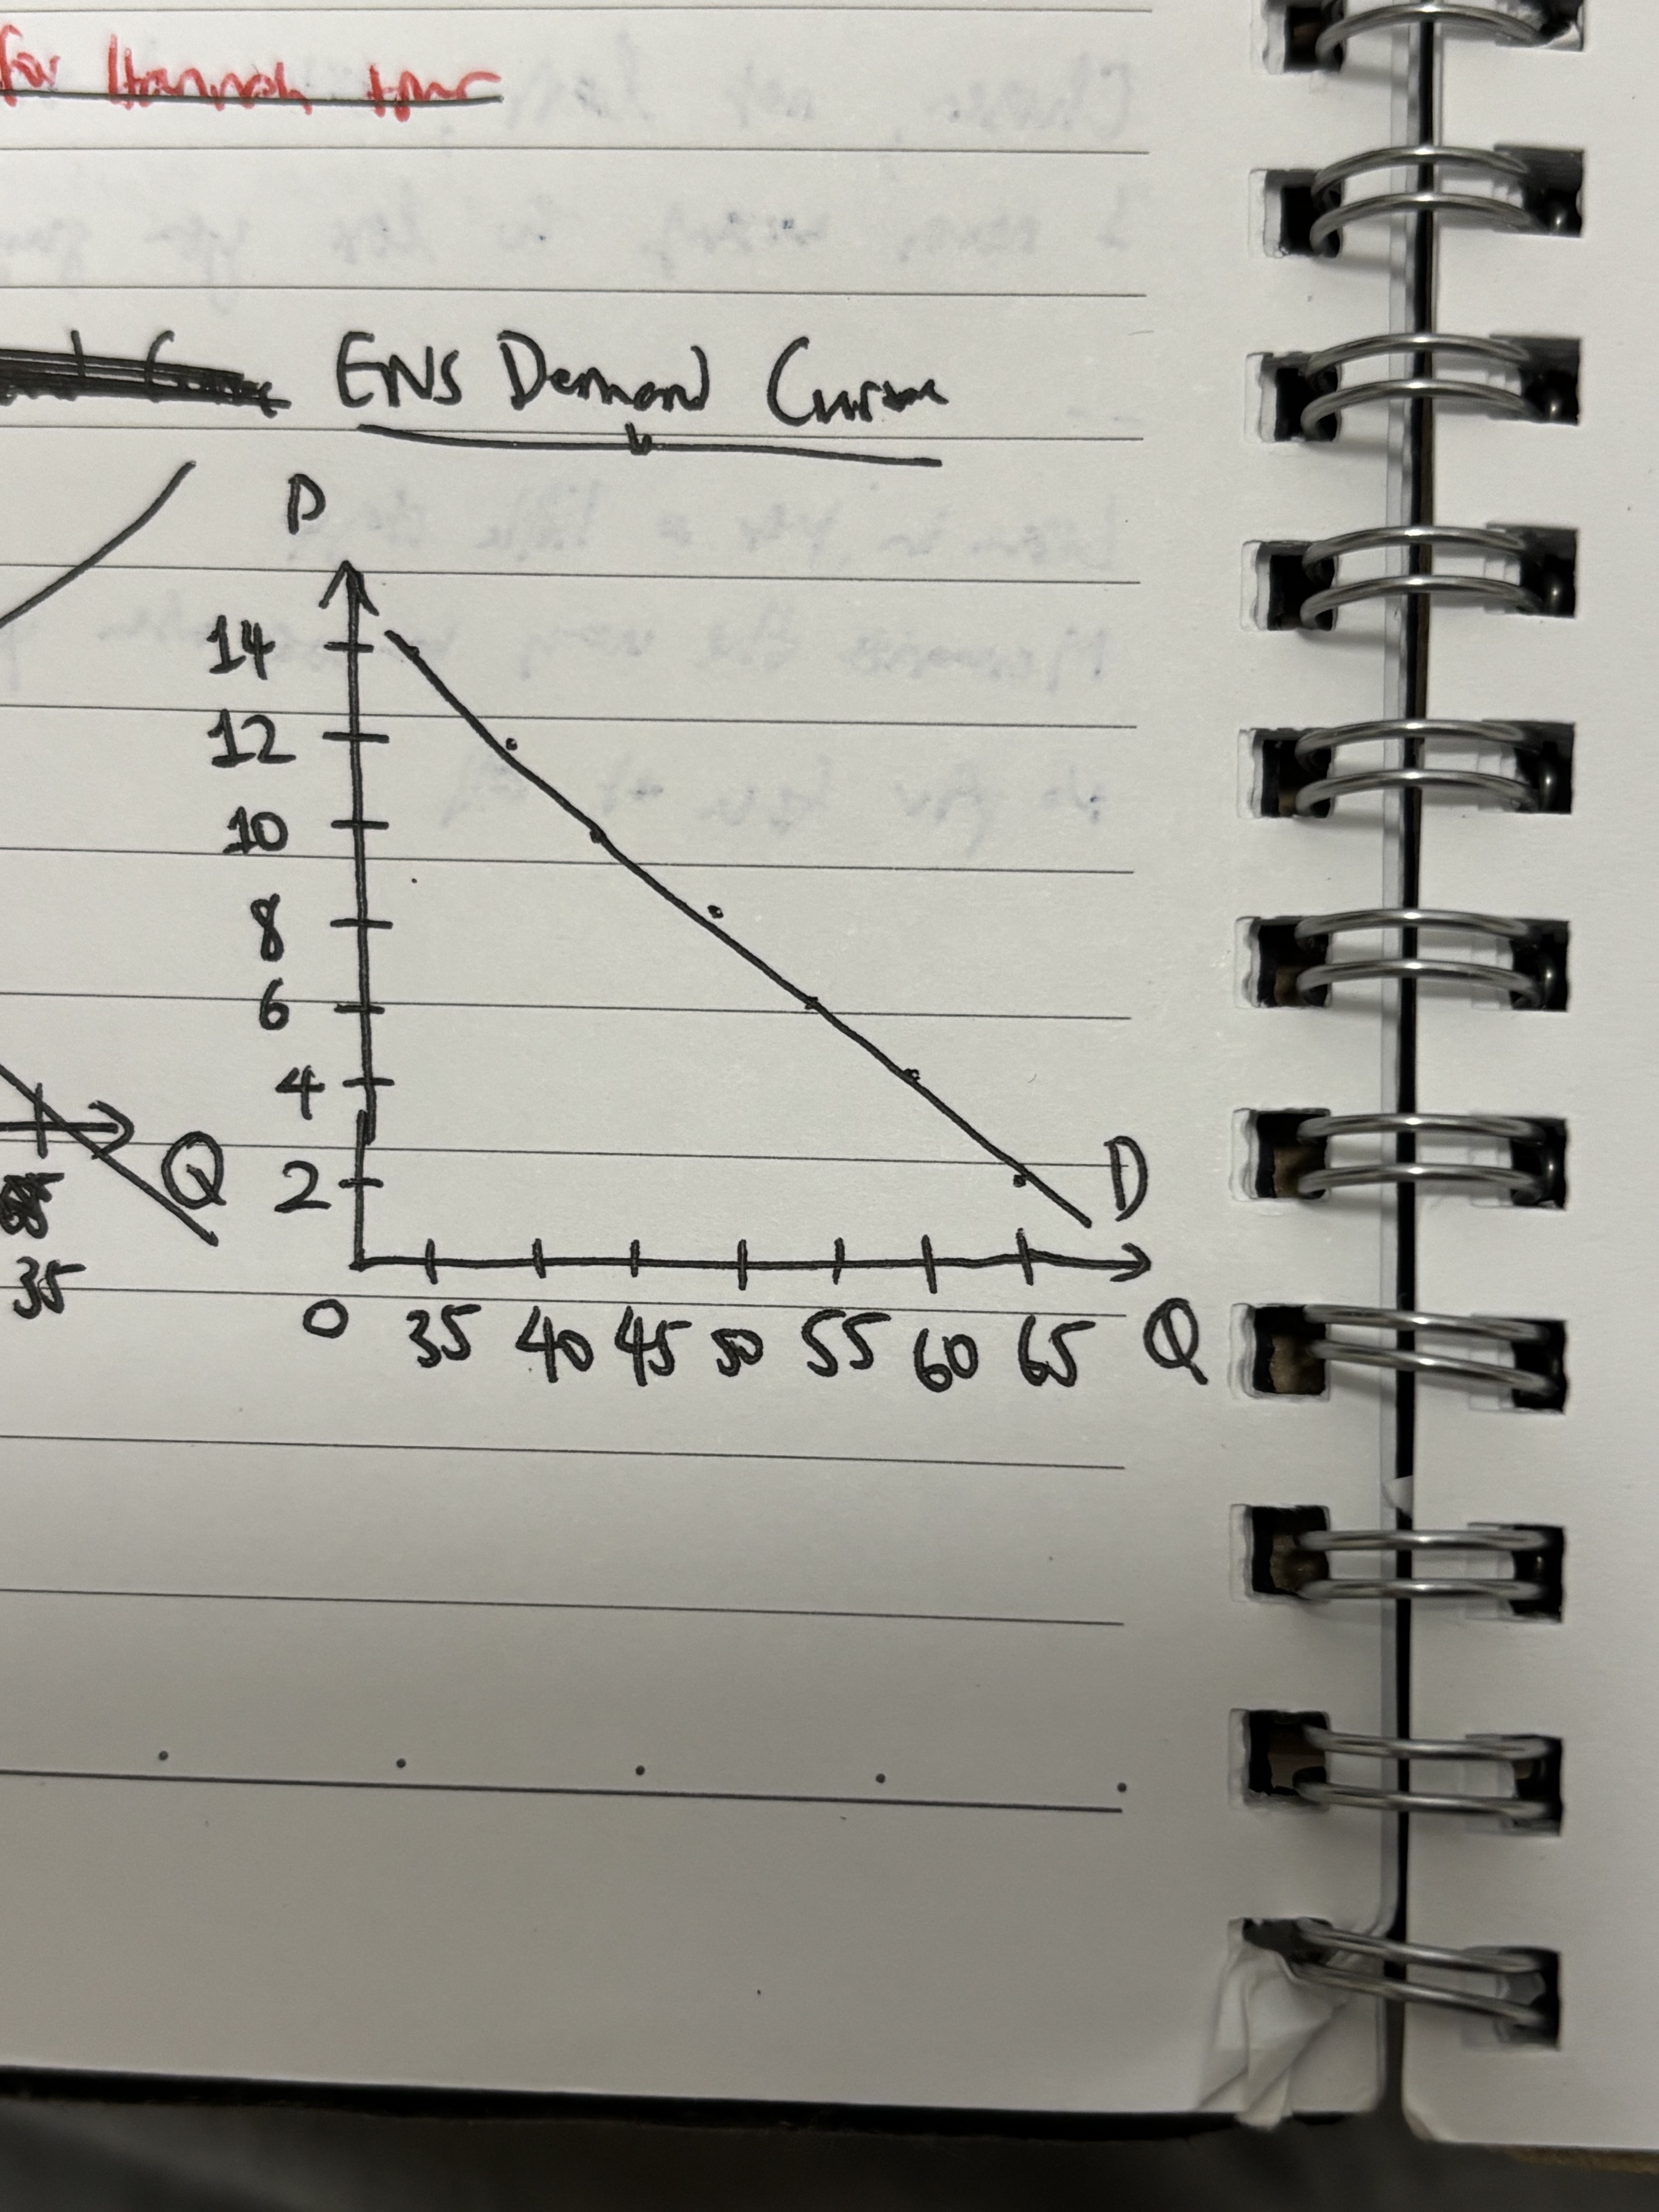
- MISTAKE: x-axis not proportional
Solution:
Why isn’t the price the same for everyone?
- a buyer compares WTP with market price
- if WTP > market price → buy
Horizontal Summation
Learning Objectives
- Aggregate demand curves using demand schedules
- Aggregate demand curves using simple math
How-to
Summary
Aggregating individual demand curves to get the total demand curve?
- Obtain demand schedule
- Add the demand quantity of each buyer together per row to get the market demand
- Plot new curve
Using algebra
Demand curve formula
Demand curve formula
- : price; exogenous variable
- exogenous variable: a factor whose value is determined outside the economic model being studied
- influences the system or internal variables but is not affected by them in return
- : -intercept (choke price)
- : slope
- : quantity demanded; endogenous variable
- endogenous variable: a factor whose value is determined or influenced by other variables inside an economic model
Important
The equation should ALWAYS start with ; use algebra to rearrange if it doesn’t.
Example
- If P = \8\text{Q}_\text{d}$ is still zero because it’s above the choke price
if and only if .
Link to original
Find the gradient:
TODO Problem: Find Carlos’s demand curve
Demand curve shifters
Demand curve shifters
Learning Objectives
- Understand what a shift in the demand curve means
- Enumerate common factors that shift the demand curve in each direction
Summary
Demand curve shifters are factors that shift the demand curve either left or right.
Important
- Movement along the curve → price changes
- Shift along the curve → change in non-price factors
Left right left right swing it to the beat –Strategy by Twice
- LEFT
- factor causes quantity demanded at each price to decrease; falls → whole demand curve shifts to the left
- decreases willingness to pay
- e.g. KitKats – presence of substitutes, preference for healthier snacks, less pocket money
- RIGHT
- factor causes quantity demanded at each price to increase → whole demand curve shifts to the right → higher willingness to pay
- this is by quantity of good consumers want to buy, regardless of price
- e.g. KitKats – students hungrier after a 5-hour class, more money for discretionary food items, no substitutes available
- monotonic: if you like a good more, it shifts; if you like it even more, it shifts in the same direction
Common demand shifters factors
- availability of substitutes
- preference
- changes in prices of substitutes (‘in place of’)
- cheaper substitutes → consumers buy those → less demand for the OG Product A
- more expensive substitutes → consumers go to Product A
- price/availability of complements (‘together with’)
- e.g. laptops & software going hand-in-hand
- number of buyers (population)
- income of buyers
- income ↑ = demand for NORMAL GOOD ↑ (most goods – e.g. household appliances, food, clothes)
- income ↑ = demand for INFERIOR GOOD ↓ (instant noodles, canned meals)
- neutral goods: regardless of income, e.g. you wouldn’t buy lots more toothpaste if you became a millionaire tomorrow
- expectations about the future
- ↓ expectations = ↑ demand
- e.g. price to increase, or scarcity
- ↑ expectations = ↓ demand
- complacency that product is always going to be there
Testing hypotheticals
Link to original
- Determine which curve it shifts
- Determine what factors, if any
- Determine which direction it moves